Air Case Study
Adworks, a division of AT&T, in tandem with frog design created (AIR), the Audience Insights Recommendation platform: a front end reporting application that will be used during the TV advertising pre-sales process as well as during the campaign life cycle for pre, mid and post campaign insights.
The goal was to have a superior user interface design with visualization that sets Adworks reporting application apart and quickly parses TV viewing into geographies by state, region, and specific viewing zones for advertisers and their TV campaigns. I teamed with several Adworks employees, a third party vendor contracted for engineering and back–end services, their consultants along with a local front-end developer and engineer.
Role
Senior User Experience Designer
Responsibilities
- brainstorming & ideation
- client presentation
- assist lead developer with web implementation & testing
- ui component modification & creation
- wireframes
Devices
- desktop
Liaison
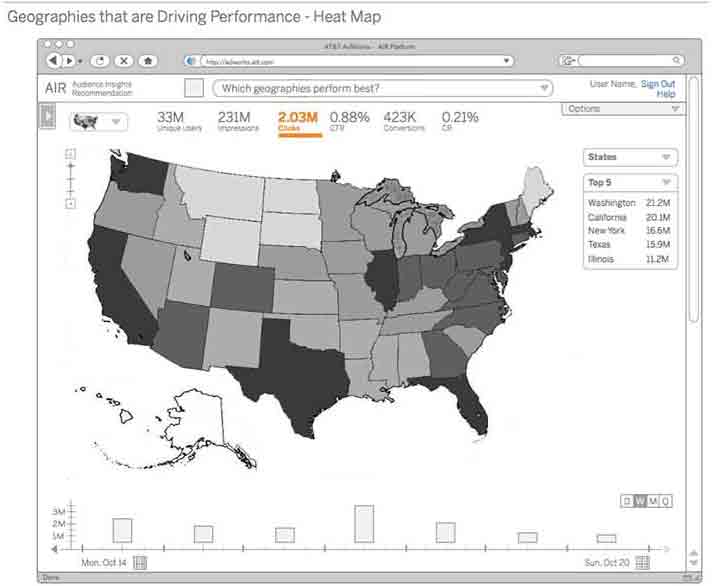
A Ux design liaison seating on the Adworks side, I collaborated with internal and external consultants along with frog's design team. I initially reviewed very early concepts, gave recommendations based on product and business requirements. Reviews followed with Adworks marketing executives in addition with several frog design brainstorming and design meetings, virtually and locally in San Francisco, CA. All visuals were created by frog. Early designs below captured segmented categories. The Heat Map below show TV performance by state or by a Designated Market Area or DMA, a geographic area that represents specific television markets as defined by and updated annually by the Nielsen Company.
advertising metrics
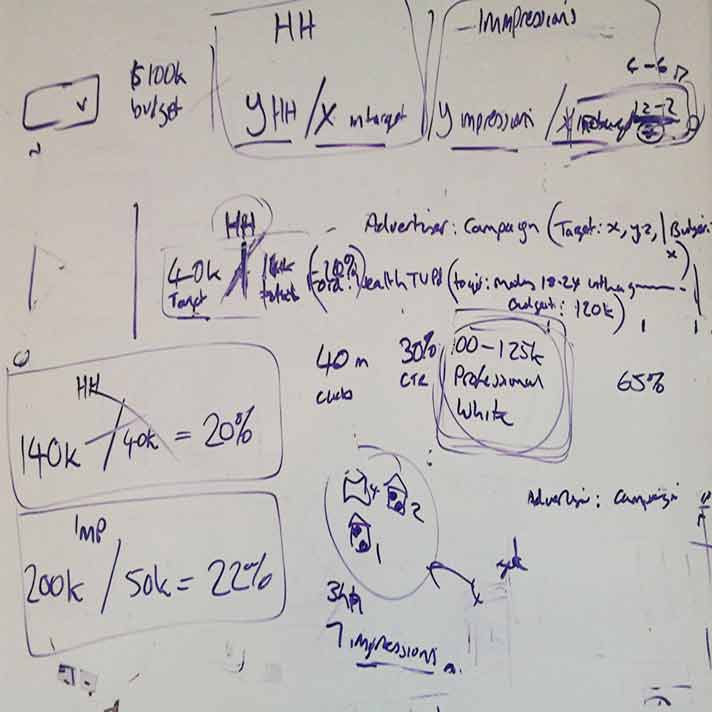
As the project started, I sat down with an Adworks manager to gather more details about their ad metrics and how it related to the AIR UI. Below is an HH (Household), Impressions, and family social segment, in this case, white professionals. This relates to how various segments (DMA, state, zip etc...) are measured and targeted by TV advertisers and their campaigns. An early AIR prototype below captured these metrics.
HH
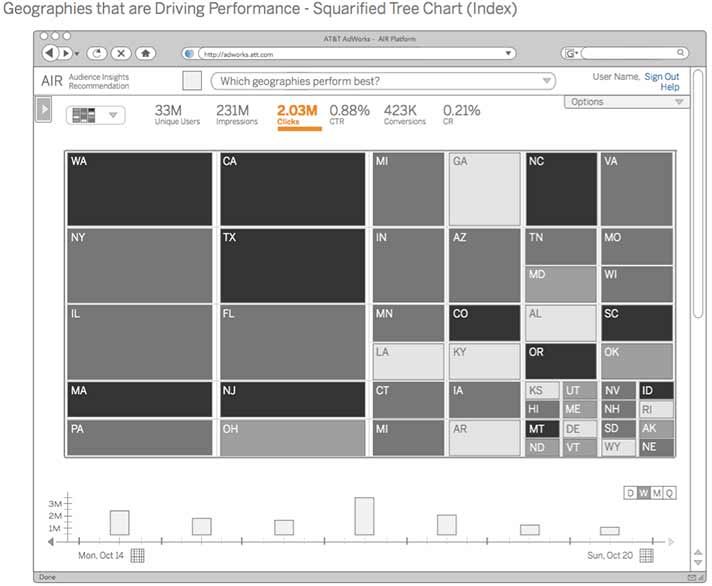
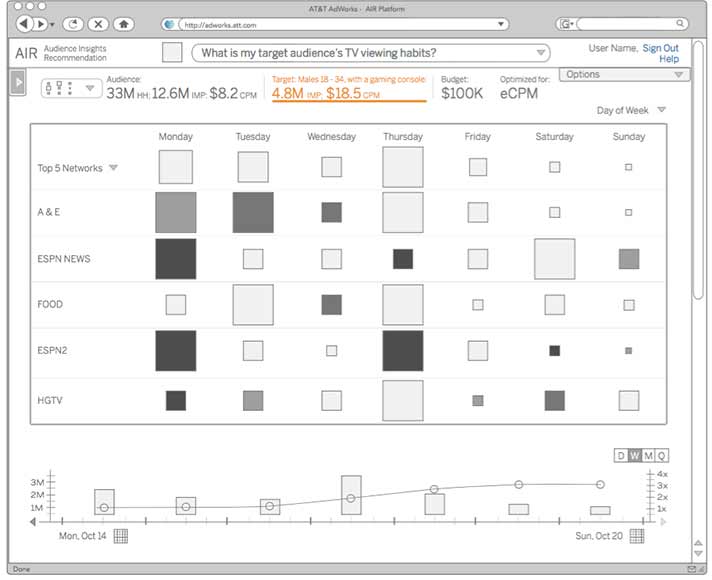
User can choose to view the heat map by state or DMA and if they have zoomed in to a single state or DMA, by zip. For Squarified Tree chart, the size = Unique Users; Color = a selected metric. As you can tell from these AIR slides, slicing time, day, and week into varying metrics reveals how advertisers can target specific TV users based on viewership.
Early iterations for the Heat Map reveal category options by state, DMA or zip were on the right side. Final designs are on the left. An interactive zoom replaced the manual zoom on the left.
Heat Map
Squarified Tree Chart
Characteristics of best performing users–Bubble Chart
Bubble Chart

Square Table
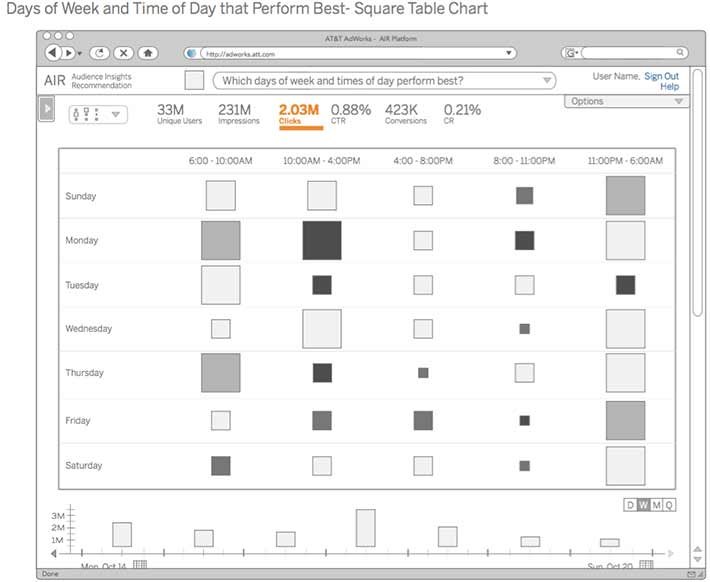
Day of Week
Time of Day
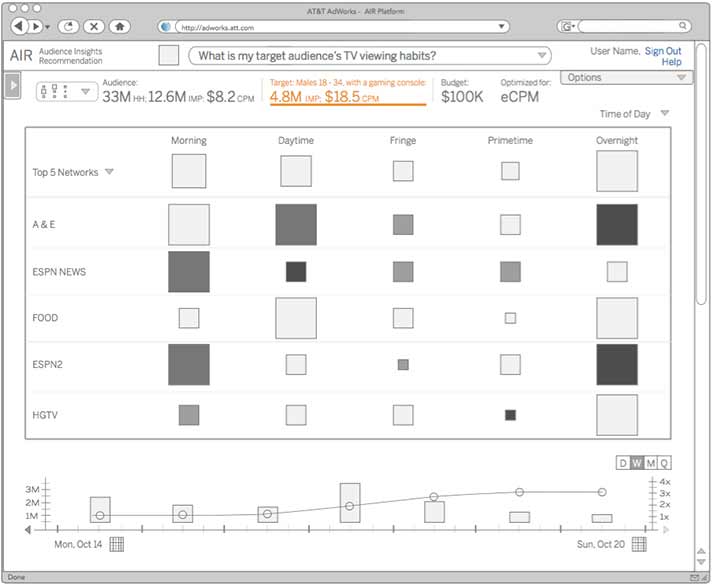
Per these wires, I worked with a front-end web developer to create an early AIR Prototype that captures the concepts in these slides. These initial designs lead to more iterative, detailed and final designs.
Lessons Learned
Before I got hired, I had two separate interviews: one with frog, another, once vetted from frog, a global IT company called Aricent. Aricent managers and developers who I worked with were based in India.
A frog design director explained to me during my interview, there was tension from the beginning: the frog design team felt an Adworks manager was trying to dictate the visual design. He didn't state the manager's name, but I easily found out as the project progressed. This precedent was at the fore front of interactions with related team members. I never mentioned it to anyone. I didn't have to.
No two projects are the same, some feel similar. Project and people variables change, sometimes, quickly. As we all know firsthand, projects and people suffer if communication is not clear, concise, and executed in a timely manner.
“Henry and I collaborated on the UI and AIR prototype; insightful, acute Ux knowledgeable, and a fun team player.”
— Alex Zavodnik Senior Lead Developer / Project AIR